
Introduction
When I freshly arrive in a company I usually have to take on and improve legacy code. Once, a company I worked at was doubtful about the quality and the maintainability of the code a contractor had delivered to them. The team I joined was asked to make an analysis of the code and to present the results to the management.
The application was a Xamarin application using the MVVM pattern. So we had to analyse two platforms, Android and iOS with shared code inside PCLs. The strength of Xamarin is to be able to share as much code as possible between platforms but the more you want to share, the better you need to understand software development principles such as SOLID and architectural patterns.
Explaining that code is bad or not to developers or technical leaders is the first step. Usually they know SOLID, design patterns and such. With informations about why a portion of code is bad a developer will often want to start refactoring it right away. The thing we need to evaluate is whether it such a refactoring is needed now or if we can (have to) live with it for the moment. Such decisions are made by the management.
Explaining SOLID and other architectural patterns is not enough for management. We also cannot just make a list of code issues and say : The class A has a method B of 2500 lines of code with n dependencies. Management needs to understand the implications of what you say and they need data. So you need to “show” them what is bad and how it is bad so as to help them decide.
In order to do so we needed some tools and here comes NDepend.
NDepend
NDepend is a static analysis tool which can highlight code issues with measurable data and generate graphics showing these issues. It is highly configurable and integrable into your continuous integration system. You can find more details on the product’s website or on wikipedia which I highly encourage you reading. For this post purpose, I’ll focus on the features we used for our project.
Before this project, I did not know how to use NDepend. Nonetheless, I got myself quickly used to it since it’s pretty well documented.
We did not have much time to analyse the application and what mattered the most to us was to quickly identify the issues and show some graphs. NDepend really shines at this since we can always choose exactly what we want to see, with which granularity and play with the interactive graphs to focus on what really matters for us.
For understandable confidentiality reasons the screenshots you will see in this post are not related to the application we analysed but it’s taken from my pet projet, a little reversi game.
Identifying dependencies
The first graph we used was the component dependency graph. This graph quickly displays the relations between different components of the application. It allows us to see if there is not some hidden relations or some unwanted dependencies.
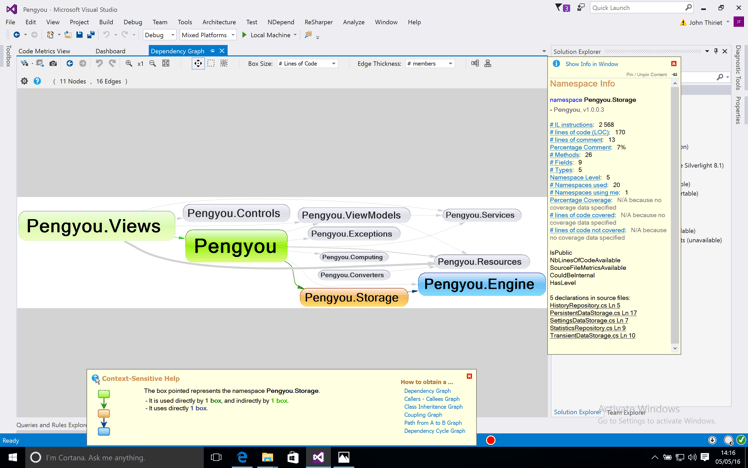
On this graph we can clearly see that the storage assembly references the game engine which is probably not the best thing to do. While simple in this case, this graph was proven priceless on our project were we saw so really unwanted dependencies between the DTOs and the MVVM Framework used for example.
Analysing maintainability
The second graph we used is call “Abstractness vs Instability”. Abstractness means that the more abstract a type is, the easiest it is to modify. Instability means that the fewer usage of a type, the less repercussions will its modification have. Basically this graphs shows how decoupled and maintainable your type are.
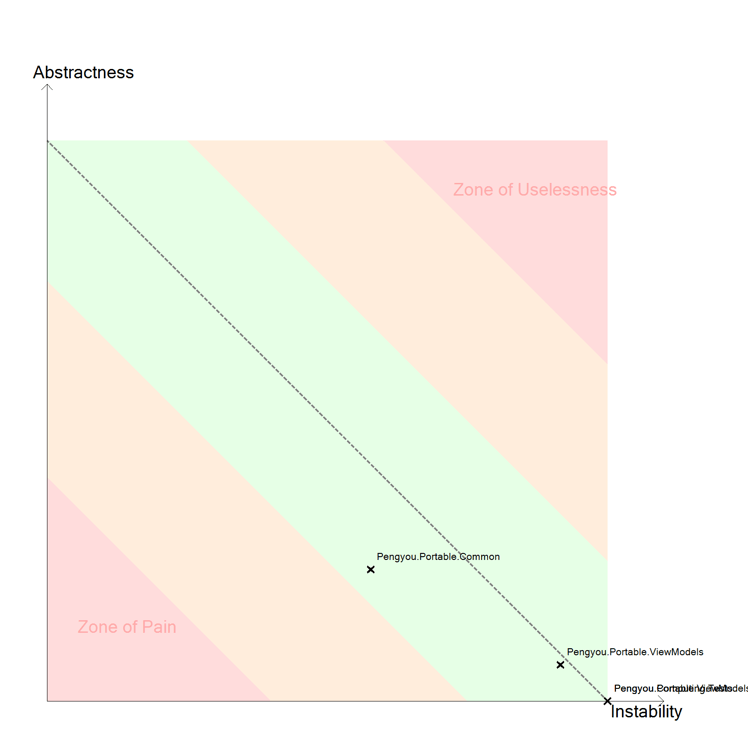
On this graph you can see different colours. Red represents an issue with the code while green means that everything looks fine. On each zone you’ll find small crosses with the name of the associated assembly. On my pet project you can see that everything looks fine since all the assemblies are located inside the green zone. On the project we had to analyse, there were several assemblies in the “zone of pain”. Basically, if you have an assembly inside the zone of pain, it means that you have a lot of non-abstracted and overused types. Such types will hurt your refactoring confidence and speed.
Cyclomatic complexity
Cyclomatic complexity measures the number of independent paths through a program. It’s a well known and a good indicator of the quality of a program. There are other tools than NDepend that can calculate the cyclomatic complexity but usually the results are shown as a long array of numbers which are not really appealing or self explaining. NDepend renders a graph of the cyclomatic complexity which is a tremendous help.
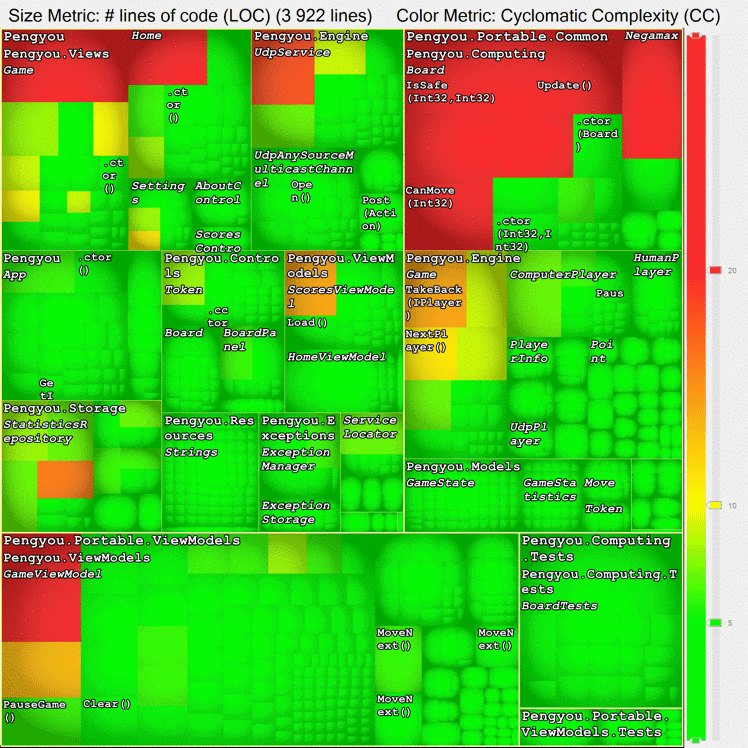
As previously, red means an issue and here the size of the rectangle also matters. A big red rectangle means a high cyclomatic complexity and too long methods. It can be normal, such as in the game engine for performance reasons, or abnormal such as in the GameView and GameViewModel. This enables me to see that I probably have to pay attention about these classes and refactor them a little
On the project we analysed it allowed us to quickly see that a core part of the application had real issue and that we would have to focus on it first for maintainability improvements.
Method cohesion
Among other neat features, NDepend also provides a graph to analyse the lack of cohesion of methods called LCOM HS where HS stands for Henderson-Sellers. This graph shows types that have too many responsibilities therefore potentially breaking the Single Responsibility Principle.
When planning a refactoring, this graph is really helpful as it shows where are the classes you may want to first break into smaller more maintainable pieces.
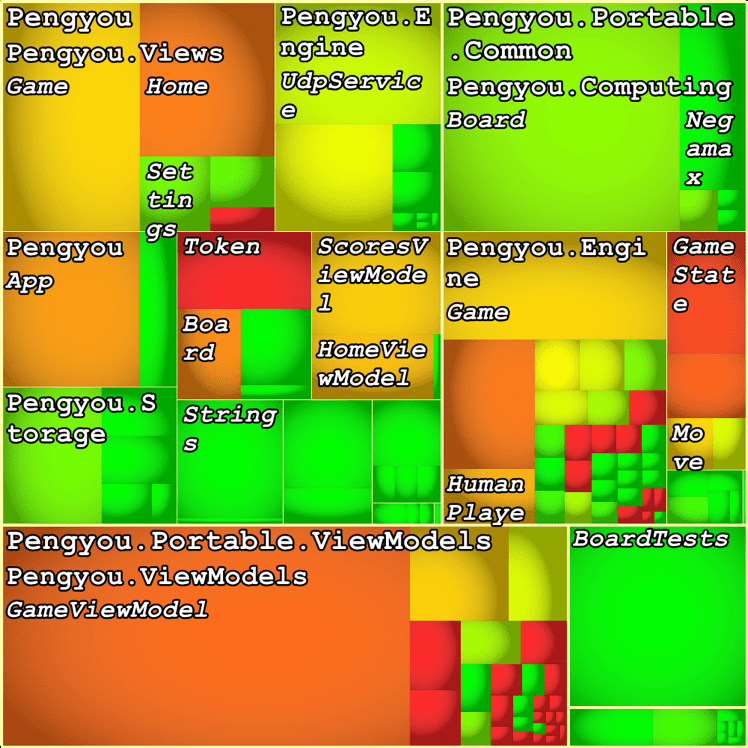
On this graph there is not a lot of red, but we can see that again the GameViewModel might be too complex because it appears in dark orange. On our project, it really enlightened the fact that most of the view models where doing too many things. When there’s one class in red, it’s not too bad, but when a third of them are red and another third orange it should be considered as a real warning.
Conclusion
NDepend helps you analyse your code. With its metrics and graphs, you can make good decisions about which part of your application needs refactoring and which part not. It helps showing non technical people why you might need some time to implement the functionality they want or just to be able to improve the program. In our case it helped us a lot by quickly showing with 4 graphs, where were the issues located and why it was pretty bad for the maintenance. Having done such an analysis enabled the top management to understand the issues and to unlock some budget to refactor the program before doing any further improvement.
If you want to dig further I highly encourage you to take a look at the dependency structure matrix and CQLinq default rules and queries
I would really like to thanks the folks from NDepend for their work and can only recommend that you check what it can do for you.
Comments