Introduction
For this blog post, I consider that you know how to export analytics data from your mobile application from App Center to Application Insights. If it is not the case you will find all the information you need in the previous article.
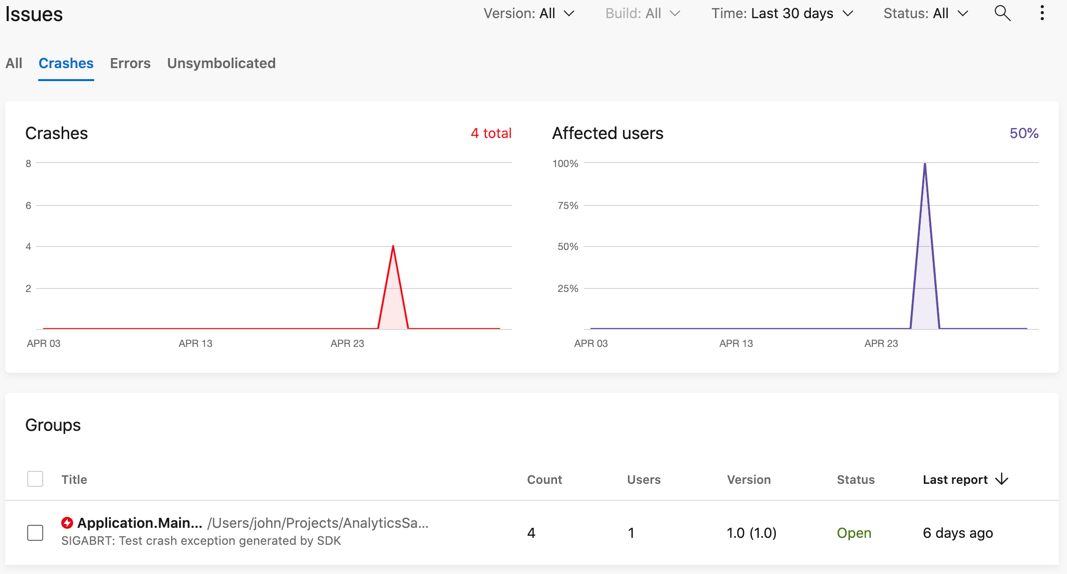
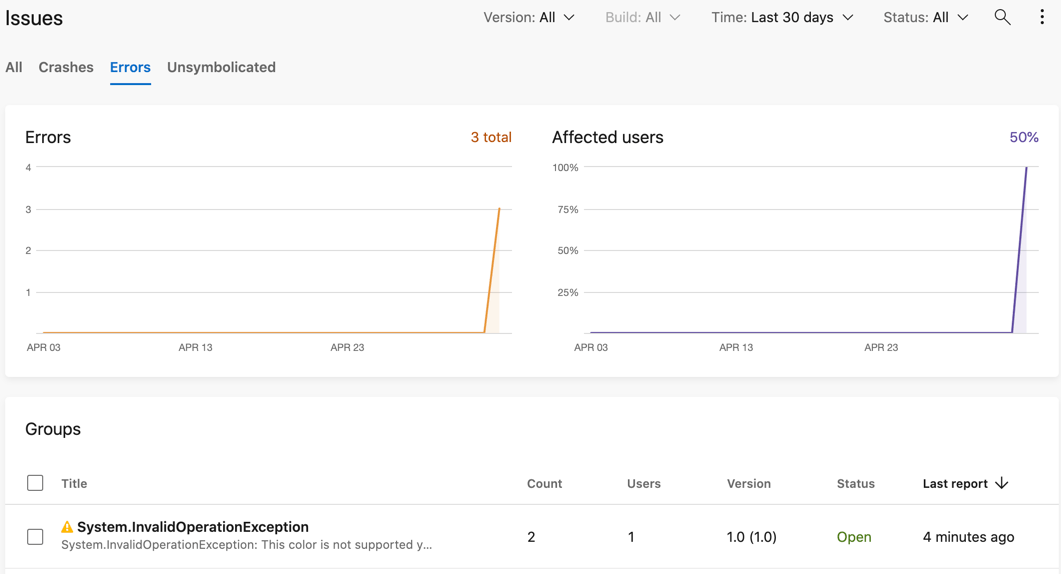
As a mobile developer, I consider that one of the biggest tasks we have is to deliver an application that has as few errors as possible. App Center comes with a very complete and cool dashboard where the distinction is made between two kinds of errors: crashes and handled errors.


Sometimes we need to present data in a custom dashboard this is where Application Insights comes into play.
Application Insights
App Center does not export issues to Application Insights in the same way you can see them in App Center dashboard. Instead, it just exports the fact that an issue has occurred which is more enough to create some interesting request.
Crashes
Let’s start easy by looking at all the crashes data sent to Application Insights:
customEvents
| where name == "UnhandledErrorLog"
| limit 1

Handled errors
Handled errors are managed in the same way as crashes inside Application Insights. The only difference is the custom event name:
customEvents
| where name == "HandledErrorLog"
| limit 1
Extracting data
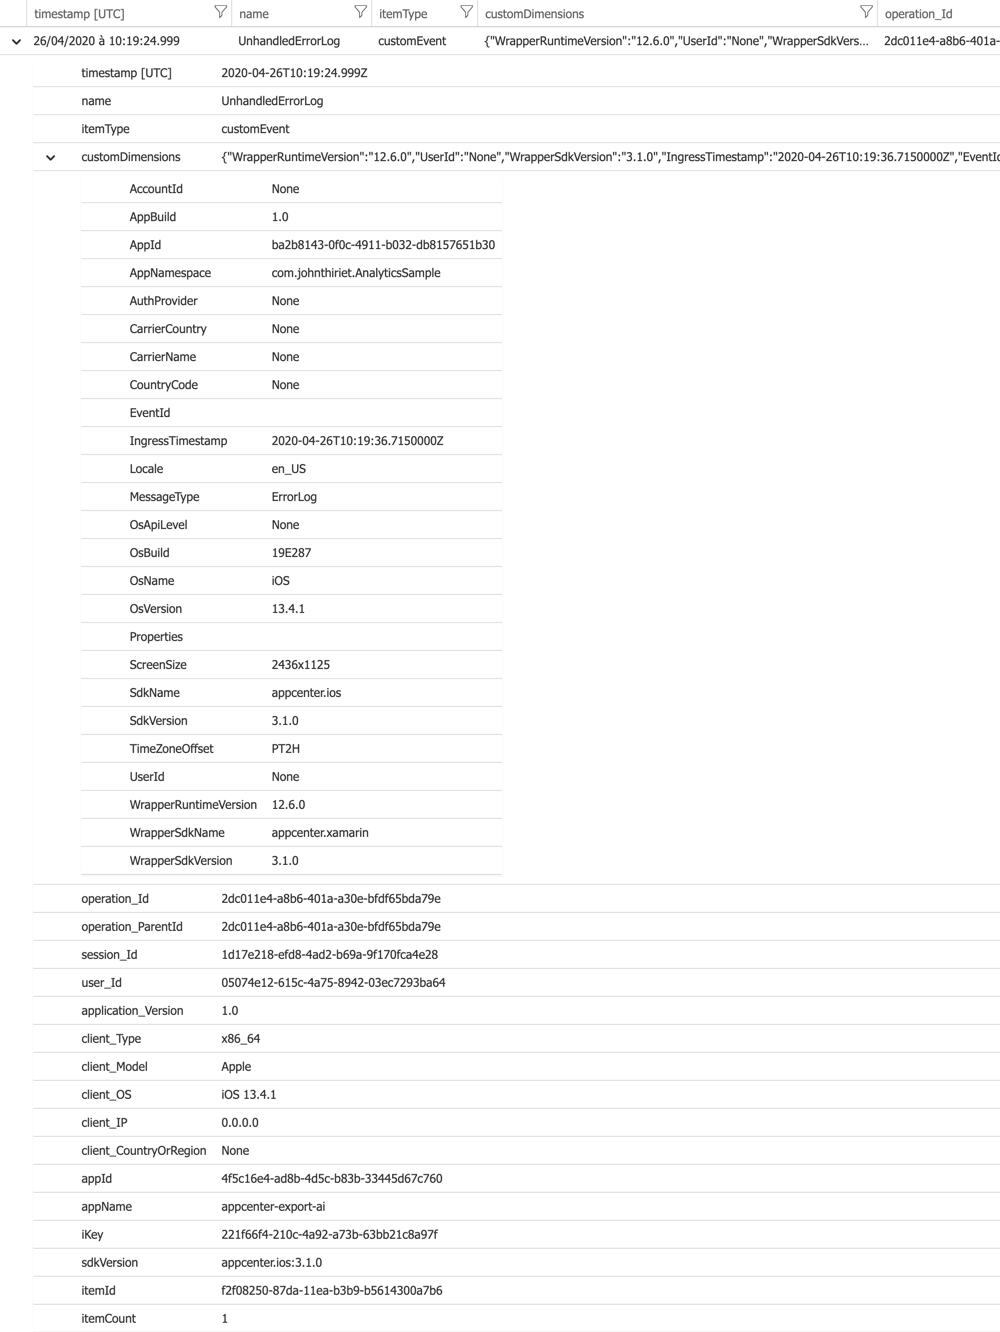
As you can see in the screenshot above, we have an entry for a crash and this entry contains data that can help to build a custom dashboard:
- Operating System name and version
- Device model and type
- Date, time zone, locale, and country
- User Id if defined
- Application version and build number
Let’s create a more interesting request in Application Insights that gets the number of crashes on iOS per day, per platform, per country.
customEvents
| where timestamp > ago(30d)
| where name == "UnhandledErrorLog"
| summarize crashes=count() by bin(timestamp, 1d), client_Model, client_CountryOrRegion
The same can be done for handled errors.
customEvents
| where timestamp > ago(30d)
| where name == "HandledErrorLog"
| summarize crashes=count() by bin(timestamp, 1d), client_Model, client_CountryOrRegion
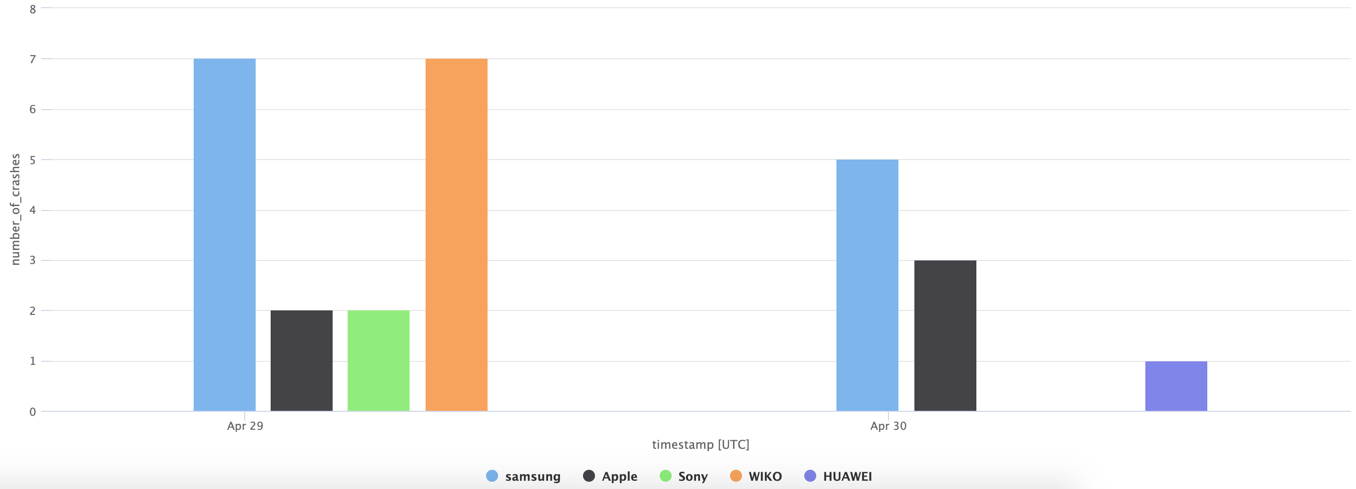
And this is the kind of results we can get:
| timestamp [UTC] | client_Model | client_CountryOrRegion | crashes |
|---|---|---|---|
| 4/30/2020 | samsung | fr | 3 |
| 4/30/2020 | samsung | us | 2 |
| 4/30/2020 | Apple | fr | 4 |
| 4/30/2020 | Apple | us | 1 |
| 4/30/2020 | HUAWEI | fr | 1 |
| 4/29/2020 | samsung | fr | 7 |
| 4/29/2020 | Apple | fr | 2 |
| 4/29/2020 | Sony | fr | 2 |
| 4/29/2020 | WIKO | fr | 7 |

Of course, the data here is fake. What is important to see is that you get a duplicated entry per day because we asked to have the phone model as well as the country. This data can then be used to generate some graphs directly in Application Insights or even better in a Power BI dashboard.
Conclusion
With App Center we can collect data about crashes and errors. Thanks to Application Insights we can query this data to create a meaningful tailored dashboard. While we do not get all the details about those errors it can still provide data that would be hard to expose in another way.
If you need to extract all those data, please stay tuned for an upcoming post! If that is of any interest to you, please let me know on Twitter or in the comments below if you’d find it interesting.
As always, please feel free to read my previous posts and to comment below, I will be more than happy to answer.


Comments